A comparison between the OnePlus One and the iPhone 6, we look at performance, screen quality and the camera:
Tag: benchmark
-
Core i7-4790K Performance Testing (HDD & SSD)
A friend of mine let me use his computer for some testing. We first ran the tests using a Western Digital Black hard drive, then using a Samsung 840 Evo solid state drive.
System Specs:
Core i7-4790K
16GB Corsair Vengeance
Asus Z97-E Motherboard
EVGA GTX 760 Superclocked 2GB
Thermaltake 750W Modular Power Supply
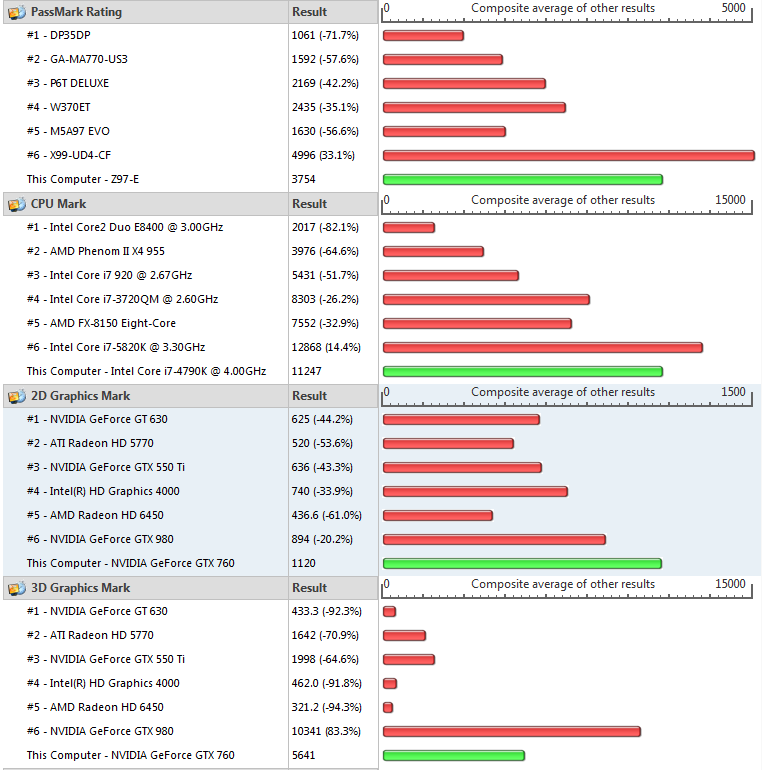
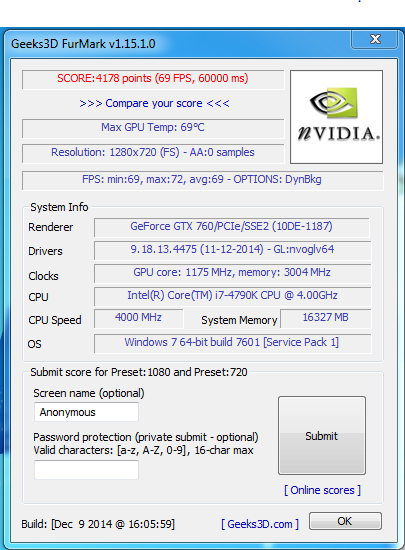
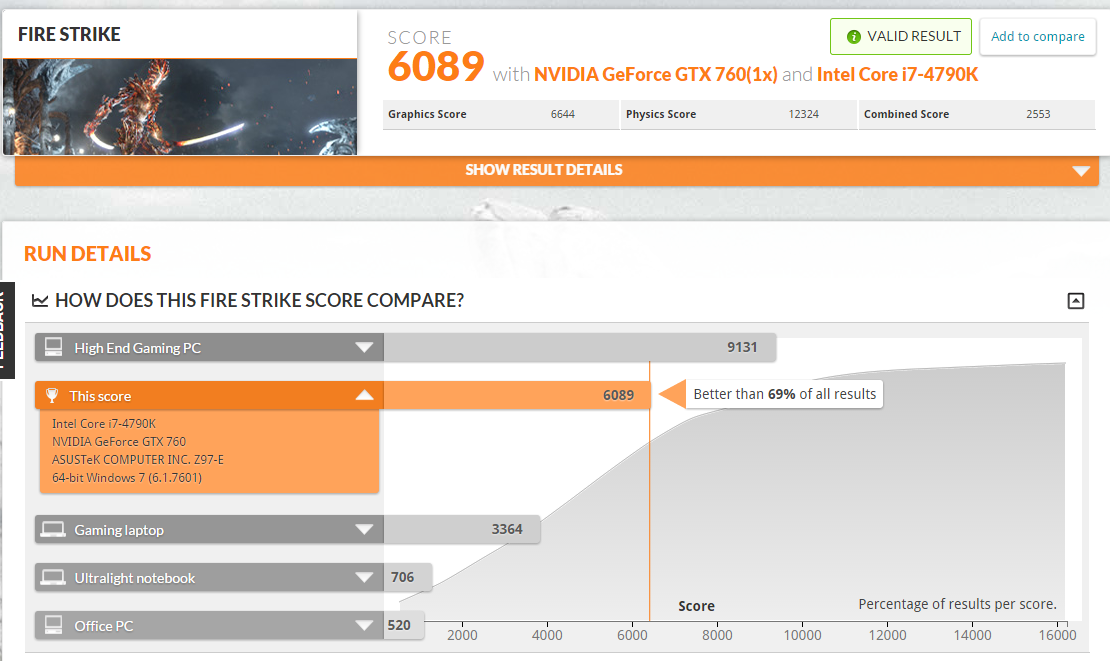
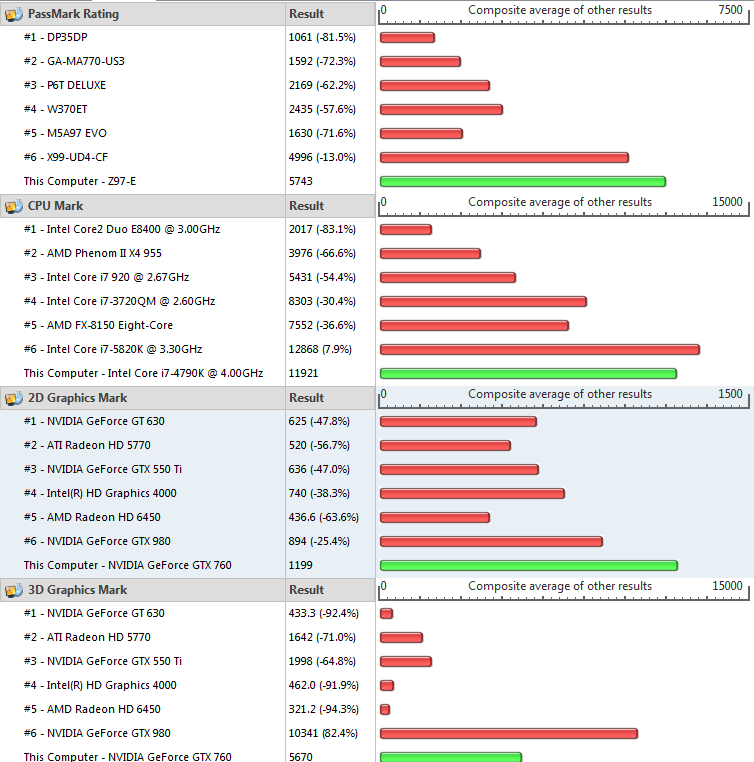
First using the Hard Drive and the ASUS Bios setting of normal, the tests were as shown below (PassMark, FurMark, 3dMark):


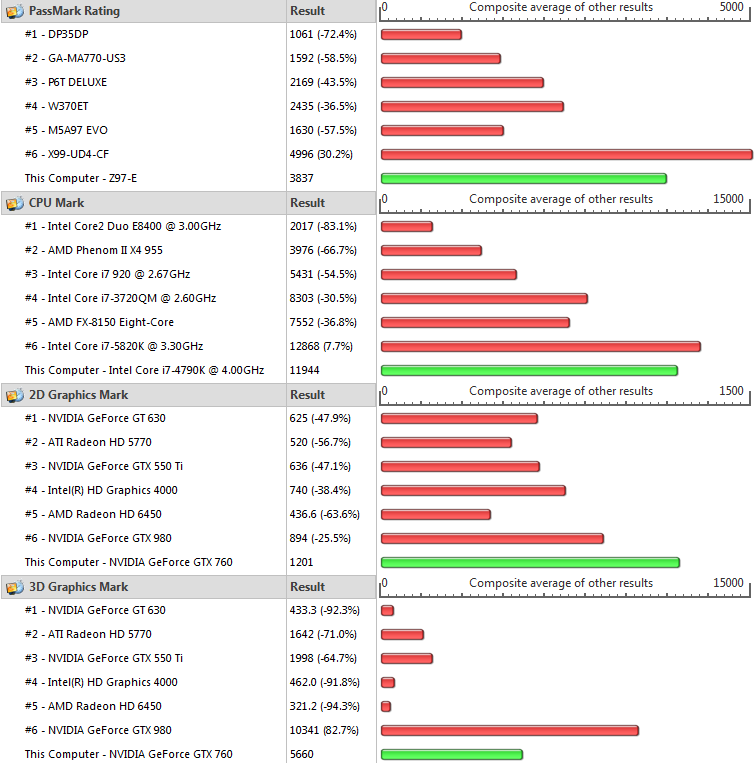
Then using the preset optimal mode in the BIOS the following performance test was completed:


Once the SSD was installed, the overall PassMark Rating was boosted by a hefty amount to 5743 from 3837:


-
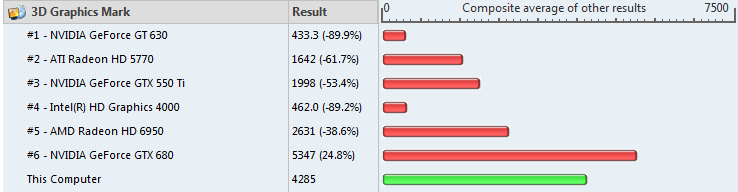
14.12 AMD Catalyst Omega Software Released
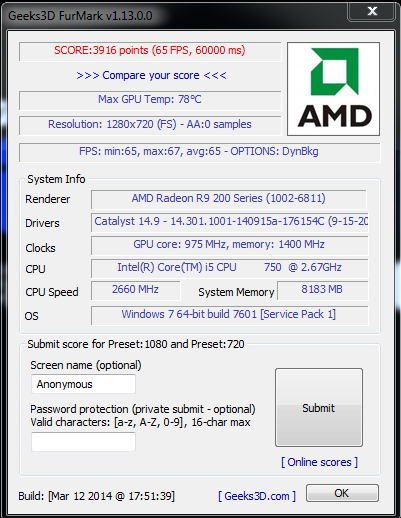
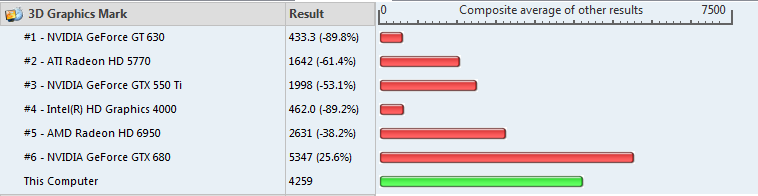
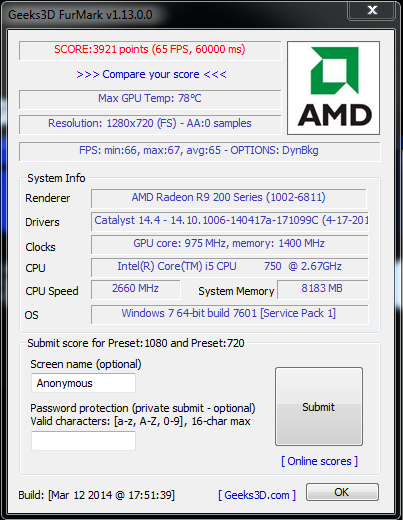
AMD has released a rather big software update called Catalyst Omega. This is supposed to allow developers to optimize their games better for AMD devices. Both graphics cards and APUs are supposed to see massive gains in certain games. In day to day tasks it runs the same as compared to 14.9 with no real difference outside of specific games. I have run 2 3D benchmarks on 14.9 and 14.12 to see if there were any general improvements to unoptimized games/benchmarks, but the results were almost the same before and after the update.
GPU: Gigabyte R9 270OC with stock clocks
Download: http://support.amd.com/en-us/download

Furmark 720p Benchmark on 14.9 
PerformanceTest 3D Test on 14.9 
Furmark 720p Benchmark on 14.12 OMEGA 
PerformanceTest 3D Test on 14.12 OMEGA -
AMD Catalyst 14.9 Stable Released
After a long wait, the stable release of the AMD Catalyst Control Center version 14.9 was finally released. This version is supposed to bring massive gains in several games and I hope it is true. In day to day tasks it runs the same as compared to 14.4 with no real difference outside of specific games. I have run 2 3D benchmarks on 14.4 and 14.9 to see if there were any general improvements to unoptimized games, but the results were almost the same before and after the update.
GPU: Gigabyte R9 270OC with stock clocks

Furmark 720p Benchmark on 14.4 
PerformanceTest 3D Test on 14.4 Furmark 720p Benchmark on 14.9 PerformanceTest 3D Test on 14.9 -
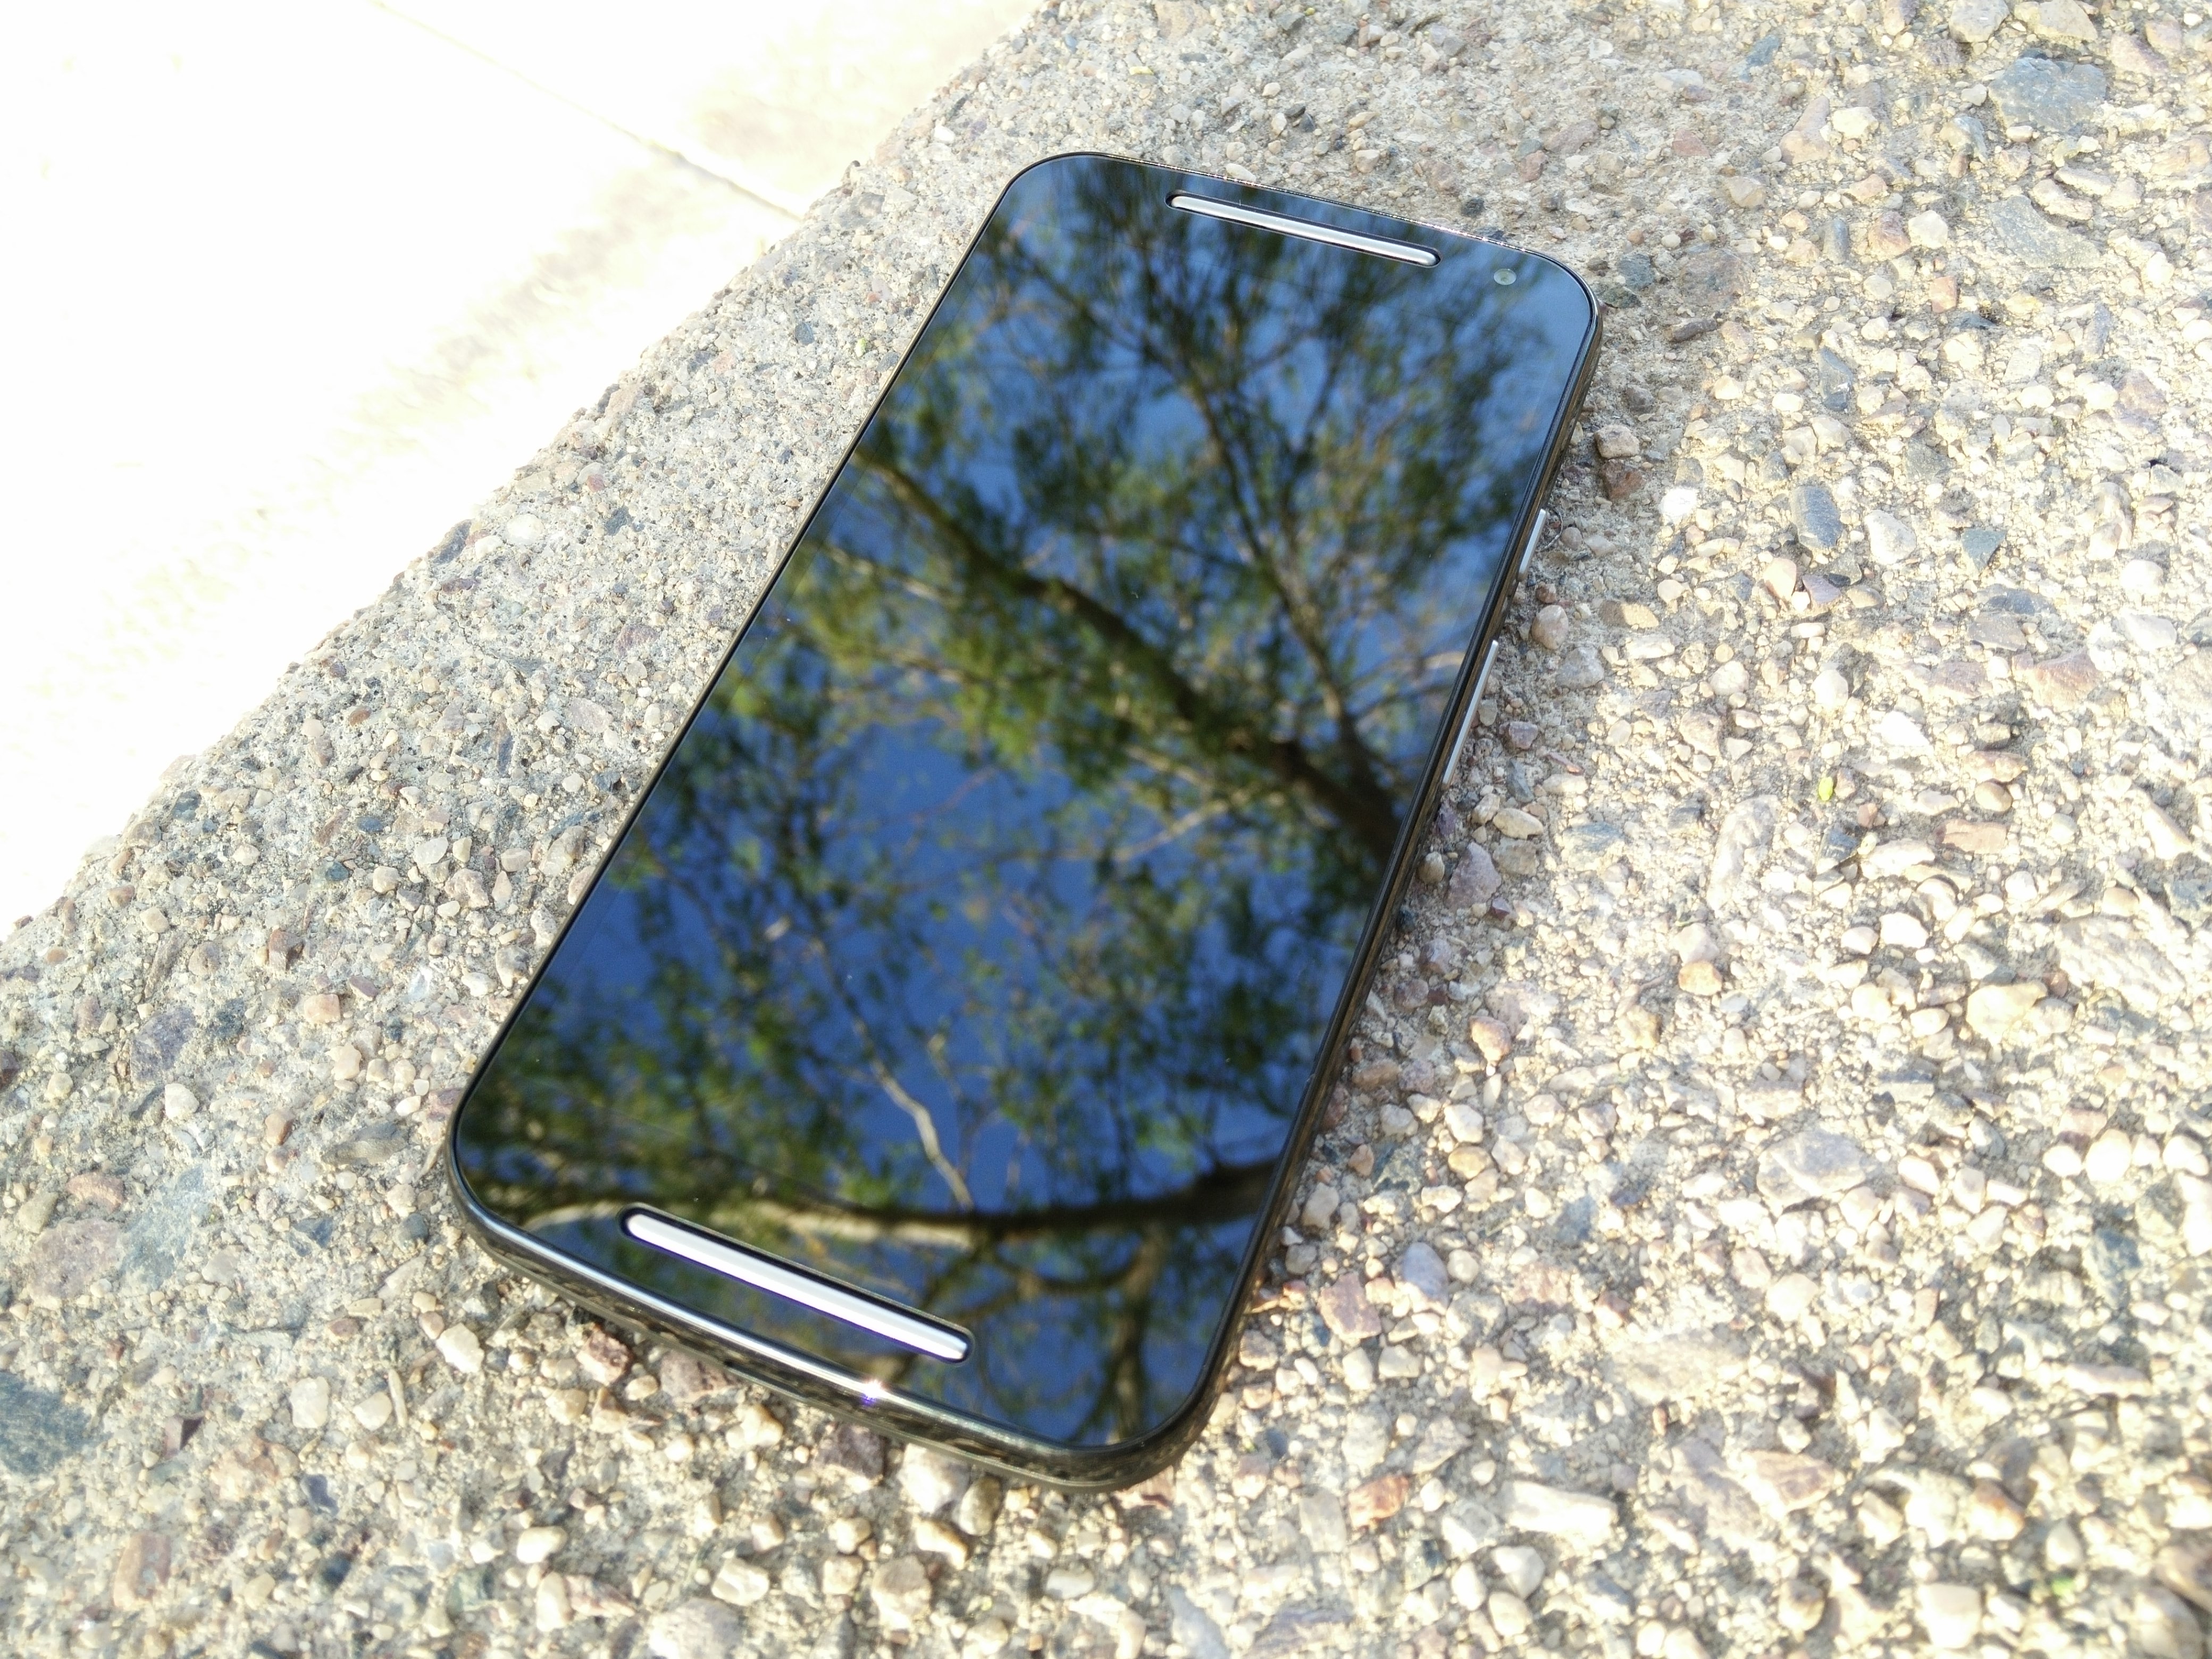
Moto G (2014) 2nd Gen Camera Test and Comparison

Moto G (2014) In the video I show many different scenarios in which the camera may be used and I compare it directly to the Moto X (2013) and the OnePlus One. It performed very well in most scenes and really passed my expectations for a phone of this price. It’s worst performance was during a macro shot as the camera doesn’t allow for getting very close. In most situations, its colors were more accurate than the Moto X and overall they looked great. It takes low res 720p videos which are decent in day time and surprisingly clear in low light, even out performing the OnePlus One while in low lit situations. It also does a great job when recording very loud audio keeping away any saturation and holding the volume at an acceptable level.
Watch the video to see for yourself whether or not it is worth it and look under the video for the raw images:

Moto G (2014) Front Cam 


-
Asus AMD R5 230 Unboxing, Benchmarks and Overclocking

Asus R5 230 The R5 230 is the cheapest and smallest of the new generation of GPUs from AMD. It can’t do much in terms of graphically intensive tasks, but when you are in need of a cheap solution that is strong enough to do anything other than game or create videos, it runs suprisingly well. It was able to play even 4k video content smoothly when loaded locally (YouTube 4k lagged as it does on my R9 270). Everything ran great in terms of operating system and web browsing tasks. I was able to easily overclock it using the built in AMD Overdrive software and temperatures never even reached 60 degrees during the Furmark benchmark. In the video below I show the card and the results of the tests I ran on both stock clocks and the overclocked clocks.
-
ART vs. Dalvik – OnePlus One Battery Life Review
We are all wondering…which gets better battery and which performs better? Watch the video to find out. I show two usual cases of standby and screen on time for each. Comparing the same usage on them both with several days of use on each after giving them time to settle in first, I have come to a definite conclusion. ART destroys Dalvik on the OnePlus One. Not only are things more responsive but it feels just lighter as if it is having an easier time running Android. This really showed in the battery life tests as I reached up to 7 hours of screen on time! If you have a OnePlus One, switch it to ART and see what I am talking about.
Here is the video review showing some screencasts and screenshots:
I have finally fixed my audio/mic recording issues and I will share how I did that soon.
-
OnePlus One Battery Life Review On ART (Android Runtime)
(Updated Comparison Post: ART vs. Dalvik): https://thelostdigit.com/2014/08/07/art-vs-dalvik-oneplus-one-battery-life-review/
I have done a video showing some of the battery life results I have been getting for the past 2 weeks that give a good estimation of how the device performs while using the ART runtime. I have been fairly please getting 6-7 hours of screen on time consistently even though I have the worst signal in my room. I want to compare it to Dalvik and have switched back now to test it thoroughly to be able to compare. Once the testing is complete I will write a comparison post comparing the performance between the two.
-
Gigabyte Radeon R9 270 OC Version

The R9 270OC This video card, even though it is priced well, is a beast. Installation was easy, uninstall the previous card drivers, remove the old card, put in the new card, and install the drivers. Immediately things were running well and much better than they used to. I was previously running a Radeon 5750 and the difference in performance is massive. Even though I have an Intel Core i5-750 CPU, the new card wasn’t bottle necked at all. Performance gains were huge in every benchmark.
Furmark 720 test: Before (1500) After (4000)
Passmark GPU: Before (1500) After (4300)
Windows: Before (7.2) After (7.9)
Homefront: Before (30 fps) After (110 fps)
Bad Company 2 Online Multiplayer: Before (30 fps) After (85-100 fps)

Top: R9 270
Bottom: 5750
Bad Company 2 Online -
Samsung SSD 840 Evo Quick Review (250GB)
The Samsung SSD 840 Evo is new, fast, affordable and very good looking. It is an elegant package that combines speed and solid performance. During Black Friday of 2013, the 250GB drive was marked down to $140 from $180 which made it an unbelievable deal at only $0.56 per GB. The purpose of this review is to give the average consumer an idea of how the drive would perform in a normal laptop and not a standard benchmarking desktop that most reviewers would use. The test laptop is a DV6-6190us (2011 Model) with a Core i7-2630QM and 8.00 GB ram running Windows 7 Home Premium 64-bit. According to the included software, the drive is connected via a SATA 3 connection which is 6GB/s and should be able to reach maximum performance.
Aesthetics:
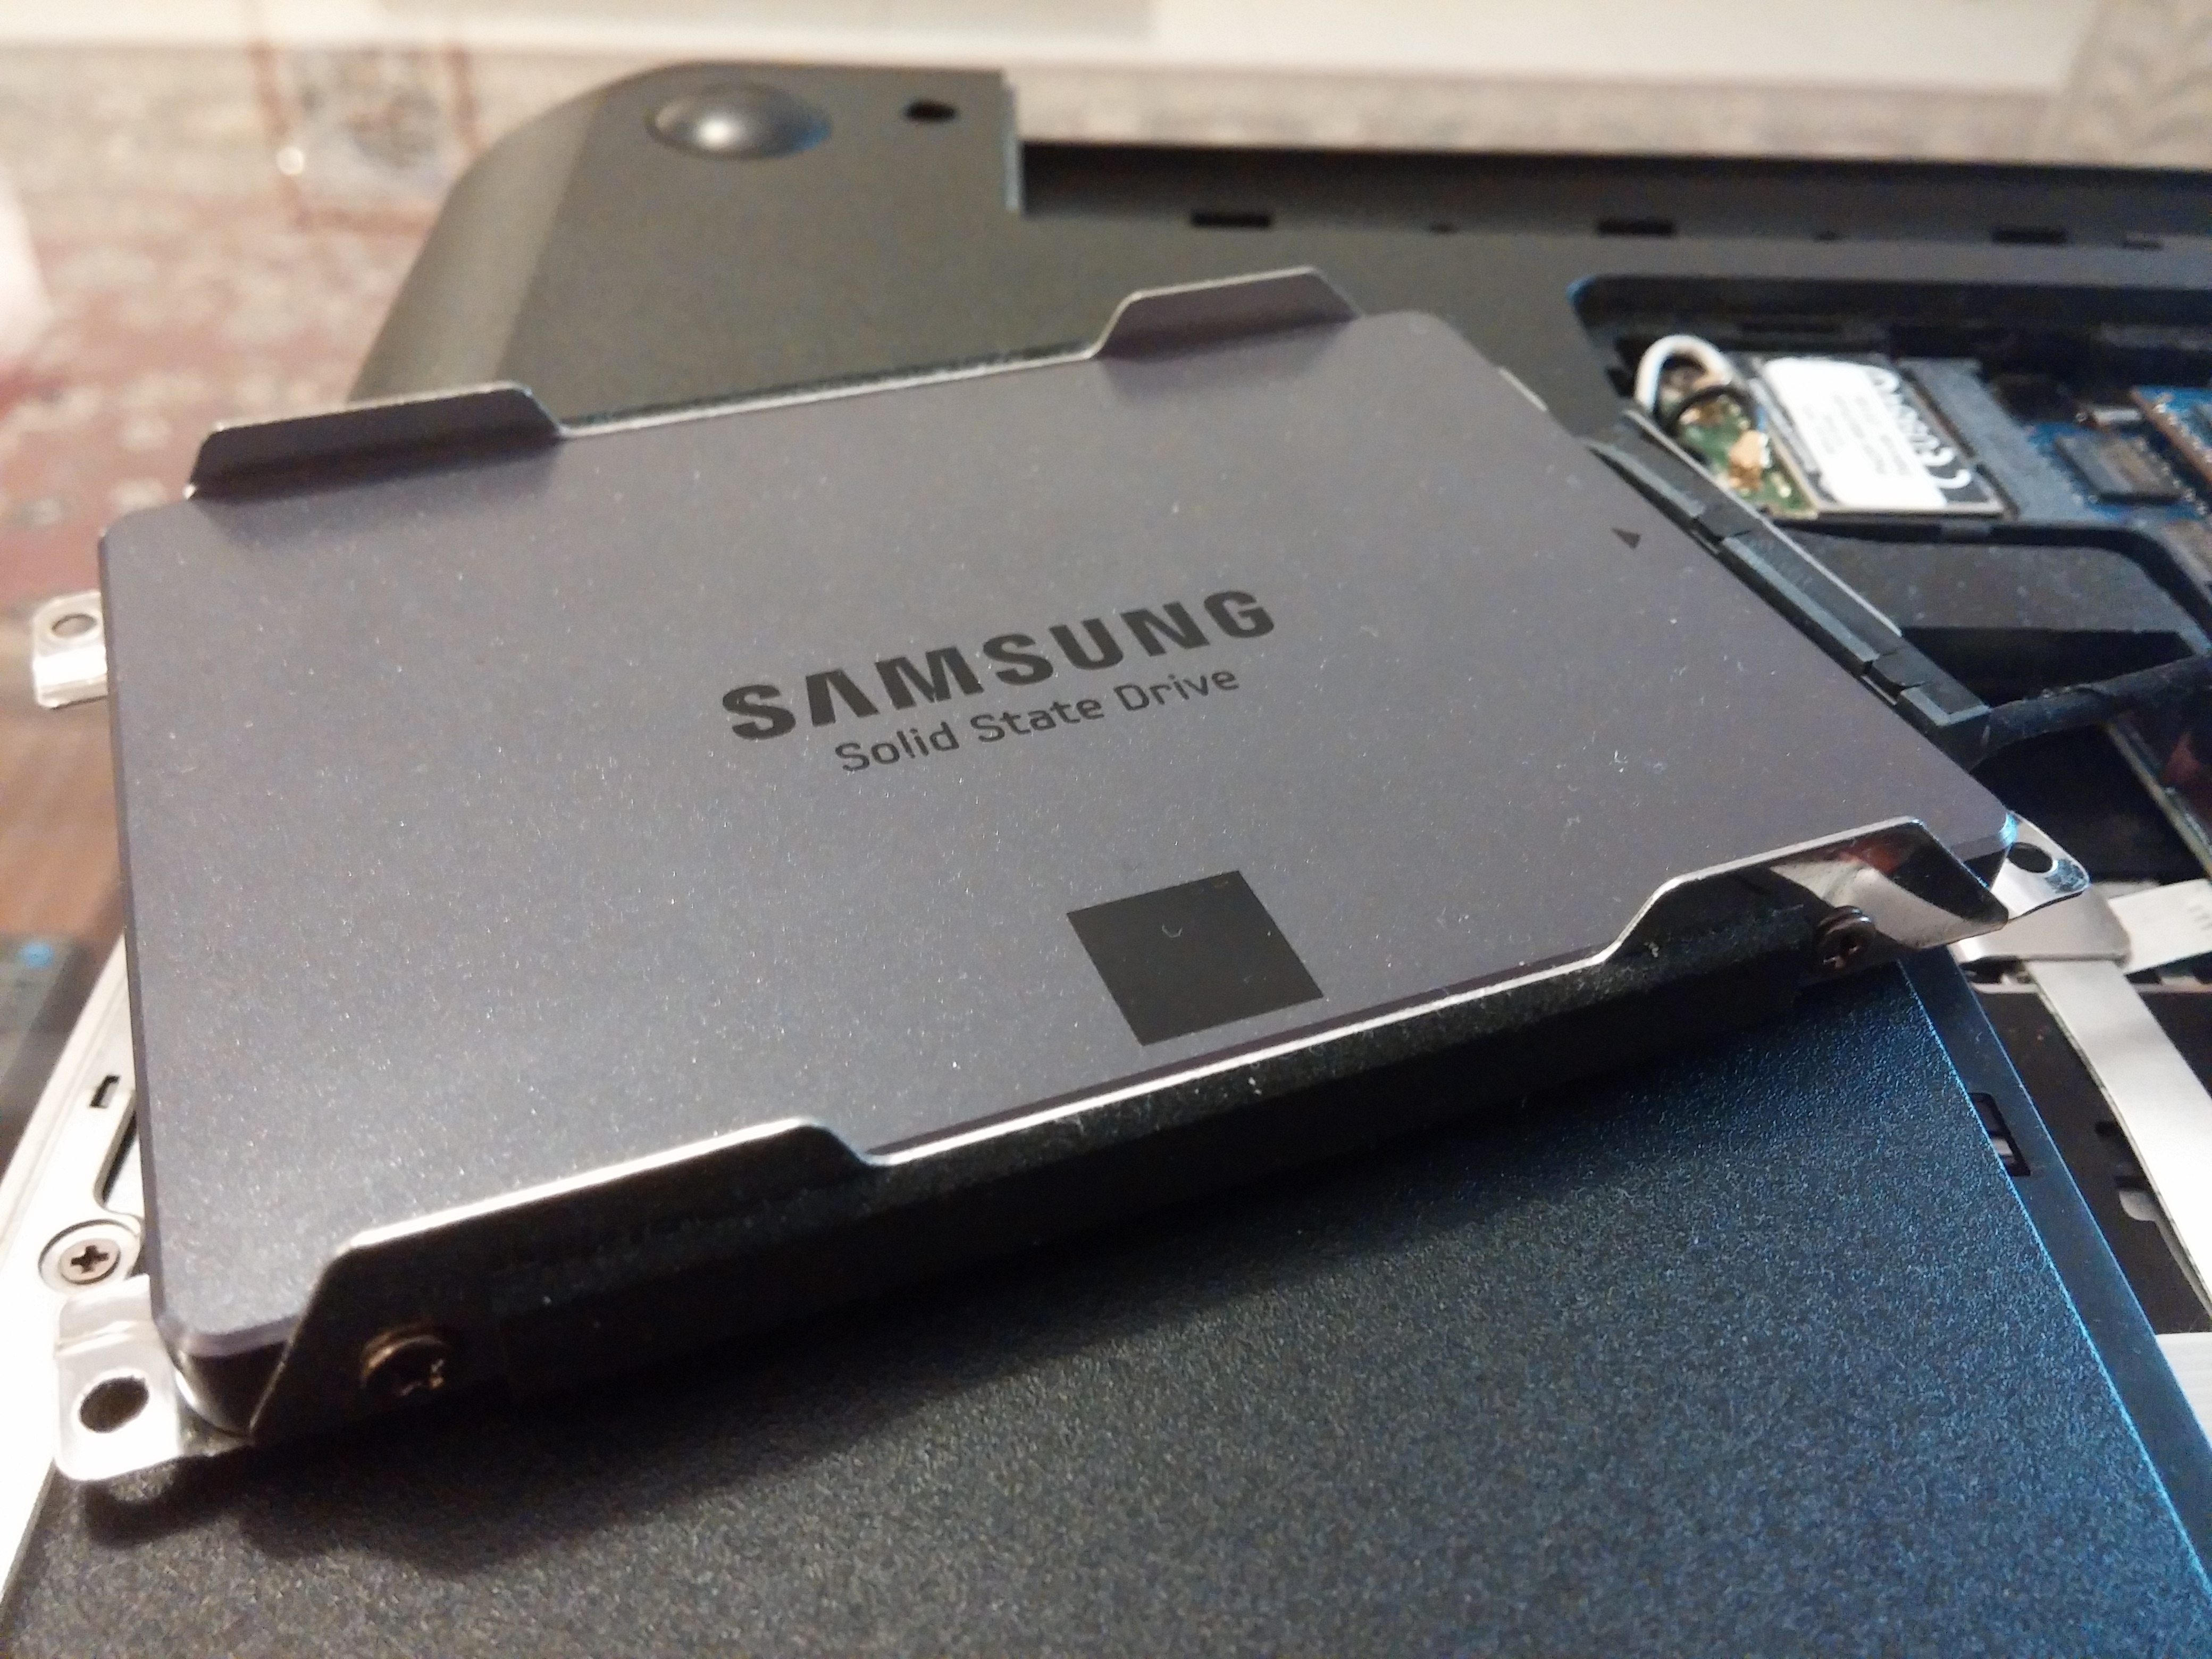
The drive is fully covered in metal and when left alone is cool to the touch. It feels very light, almost hollow and according to a review by AnandTech, the drive has alot of empty space inside. The way it looks is fierce yet sleek and is my favorite looking SSD thus far. Its simplistic design gives a modern feel to a part of the computer that may never be seen and this attention to detail by Samsung is much appreciated from my end.

The SSD in the laptop hard drive mount Performance: Does it live up to the rated speeds?
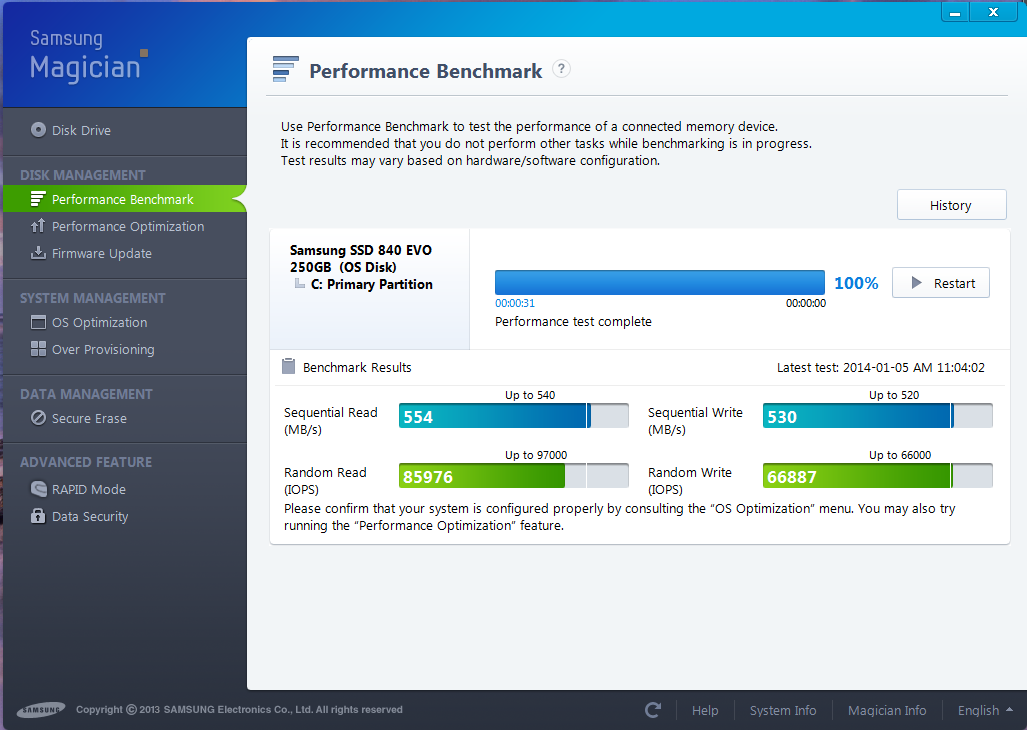
According to Samsung, the drive should reach up to 540 MB/s read and 520 MB/s write speeds. The included Samsung Magician Software has a benchmarking tool and it seems to yield positive results.

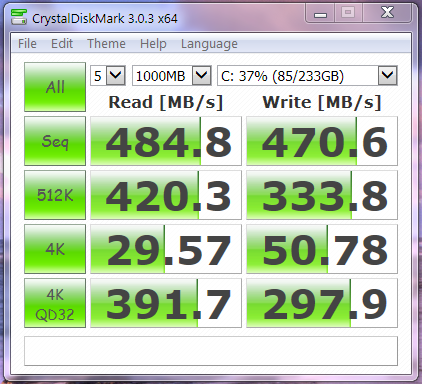
Samsung Magician Benchmark This is only half of the story, as the benchmark seems to use algorithms that work in the favor of this drive. A more standard way of benchmarking using CrystalDiskMark is shown below.

CrystalDiskMark Benchmark The read speeds averaged to be 484.8 MB/s and the write speeds averaged to be 470.6 MB/s. While these are very solid, they are well below the rated speeds by around 50 MB/s.
Boot Speed:
Boot speed has dramatically decreased and can boot to a usable environment in 27 seconds as seen in the video below.
In Conclusion:
The drive at its retail price of $180 is a great deal offering stable performance and reliability yet it can be found for an incredible $140 on sale occasionally. This drive is one of the first at this price point offering stable performance with real read and write speeds over 470 MB/s making it worth every penny. If you are in need of an SSD and don’t want to spend a lot yet desire fantastic performance, the Samsung 840 Evo line is worth every penny.
Pros:
– Elegant Design
– Fast
– Reliable
– Cheap
Cons:
– Slightly Slower Than Rated